Onboarding Metrics SaaS Teams Must Track to Improve Activation and Retention
The fastest way to improve activation and retention is to measure onboarding like a funnel, not a feeling. This guide breaks down the onboarding metrics that reveal where users get stuck, how quickly they reach value, and which behaviors predict trial-to-paid conversion—plus how to act on what you find.

Onboarding is where most SaaS growth wins (and losses) happen. But many teams still judge onboarding by qualitative feedback or a single KPI like activation rate.
If you want predictable improvements in activation and retention, you need a small set of onboarding metrics that work together:
- Funnel metrics to show where users drop off
- Speed metrics to show how fast users reach value
- Behavior metrics to show which actions predict retention and conversion
- Quality metrics to show whether users understand the product
Below are the onboarding metrics SaaS teams should track, how to calculate them, and what to do when they move.
Start with a clear onboarding goal: define “activation” first
Before you measure anything, define your activation event (or activation threshold). Activation isn’t “signed up” or “completed the tour.” It’s the first moment a user experiences your product’s core value.
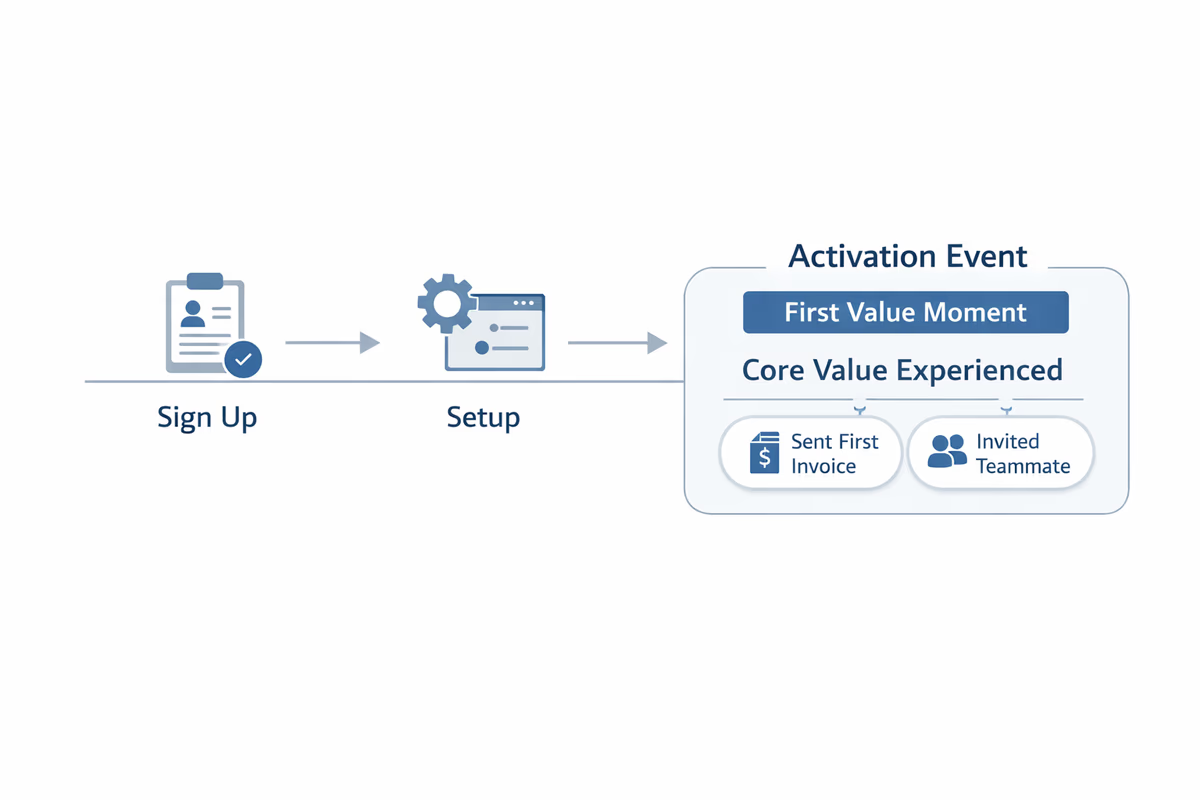
Examples:
- Project management: created a project and invited a teammate
- Analytics: connected a data source and viewed a dashboard
- CRM: imported contacts and logged the first activity
Practical rule
Your activation definition should be:
- Behavior-based (an in-app action)
- Repeatable (not a one-off like “watched a video”)
- Predictive of retention or conversion
Once activation is defined, the rest of your onboarding metrics become much easier to interpret.
Metric 1: Activation rate (by segment)
What it tells you: How many new users reach the first value moment.
Formula:
Activation Rate = Activated Users / New Users
Track it by segment, not only overall:
- Persona (admin vs end user)
- Use case (based on onboarding selection)
- Acquisition channel
- Company size / plan type
What to do when it’s low:
- Tighten the path to activation: remove steps that don’t contribute to value.
- Personalize onboarding by role/use case so users see the right “next step.”
- Add in-app guidance at the exact step where users stall (tooltips, checklists, interactive walkthroughs).
Metric 2: Time to Value (TTV)
What it tells you: How quickly users reach activation after signup.
Common definitions:
- Time from signup → activation event
- Time from first session → activation event
Track median TTV (not just average) and look at distribution (p50/p75/p90). Long tails usually indicate friction for certain segments.
What to do when TTV is high:
- Reduce setup friction (integrations, imports, permissions).
- Offer “quick start” paths: templates, sample data, default configurations.
- Replace long tours with contextual prompts triggered by intent.
Metric 3: Onboarding funnel conversion (step-to-step)
What it tells you: Where users drop off inside onboarding.
Build a funnel that mirrors your onboarding journey. Example:
- Sign up
- Email verified
- Created first workspace
- Connected integration
- Completed first core action
- Invited teammate
Track conversion between each step and the overall funnel completion.
What to do when a step leaks:
- If the drop is immediate (step 1 → 2), fix messaging, expectations, and technical issues.
- If the drop happens mid-flow, simplify the step or move it later.
- If the drop happens at an integration step, provide alternatives (CSV import, manual mode, sandbox).
Metric 4: Drop-off rate by onboarding step
What it tells you: The exact point users abandon onboarding.
Formula:
Drop-off Rate at Step N = 1 − (Users who reach Step N+1 / Users who reach Step N)
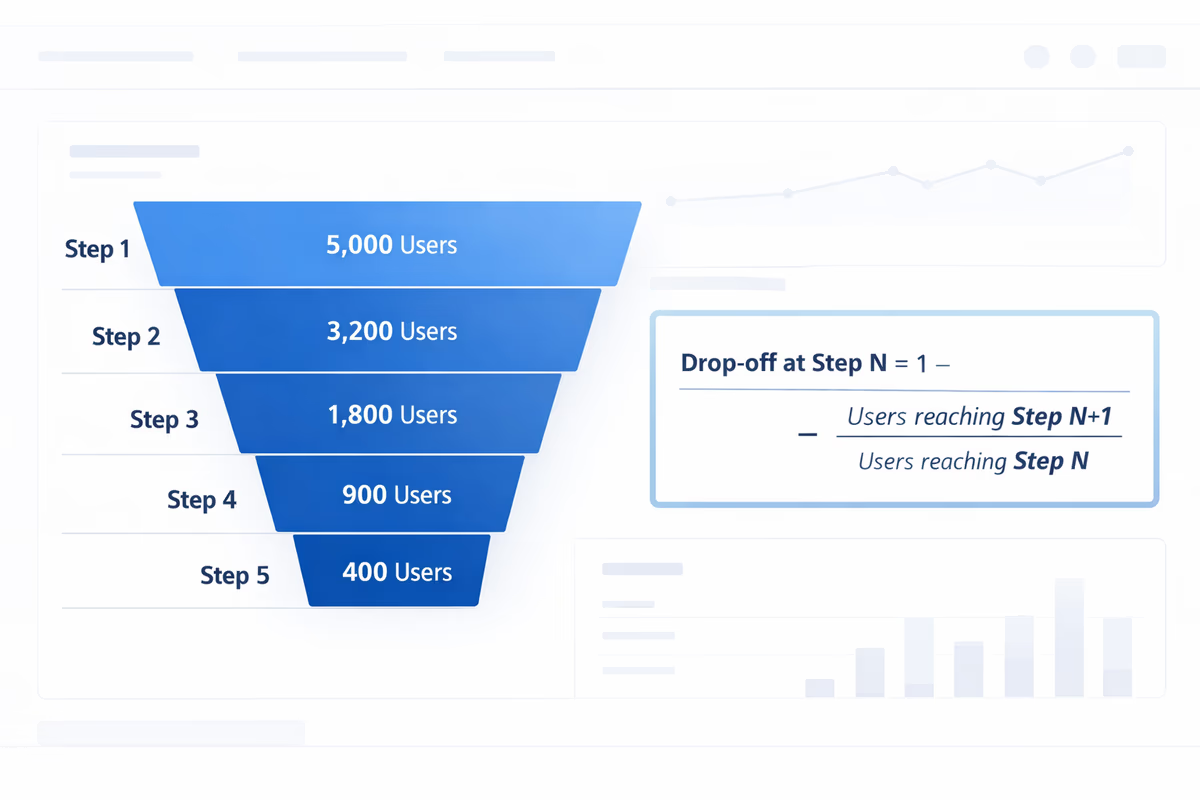
This is the metric that turns “onboarding feels confusing” into a specific fix.
What to do when drop-off spikes:
- Add microcopy that answers “why do I need this?”
- Provide a fallback path if the step fails (integration errors, permission blocks).
- Instrument error states so you can separate UX confusion from technical failure.
Metric 5: First session completion rate
What it tells you: Whether users make meaningful progress in their first session.
Define “first session success” as a small set of actions that indicate momentum (not necessarily full activation). For example:
- Completed onboarding checklist item 1 and 2
- Created first object (project, campaign, dashboard)
- Reached a key screen (builder, editor, reporting)
What to do when it’s low:
- Shorten the first session goal: focus on one “win,” not the whole setup.
- Use a checklist with 3–5 items max for day one.
- Trigger guidance based on what the user did, not what you hope they do.
Metric 6: Onboarding checklist completion rate (and time to completion)
What it tells you: Whether your guided tasks are actually being completed.
Track:
- Checklist start rate
- Checklist completion rate
- Time to complete each item
Be careful: checklist completion is not the same as activation. It’s a leading indicator—useful only if checklist items correlate with activation and retention.
What to do when completion is low:
- Remove “busywork” items (profile photo, preferences) unless they drive value.
- Reorder items so the first one delivers an immediate outcome.
- Make items outcome-based: “Create your first dashboard” beats “Learn dashboards.”
Metric 7: Key feature adoption during onboarding
What it tells you: Whether users are discovering the features that make your product sticky.
Pick 1–3 “sticky” features that correlate with retention (not every feature). Track adoption within the first 7–14 days.
Examples:
- Creating an automation
- Setting up alerts
- Sharing a report
- Inviting teammates and assigning roles
What to do when adoption is low:
- Don’t push features too early. Tie feature discovery to a user goal or milestone.
- Use just-in-time prompts after a user completes a related action.
- Add templates that demonstrate the feature in context.
Metric 8: Trial-to-paid conversion rate (with onboarding attribution)
What it tells you: Whether onboarding is producing customers, not just active users.
Formula:
Trial-to-Paid Conversion = Paid Conversions / Trial Starts
To make this metric actionable, attribute conversion to onboarding behaviors:
- Activated vs not activated
- Reached value in < X minutes/hours/days
- Adopted sticky feature A
- Invited teammate
What to do when conversion is low despite good activation:
- You may be activating users on a “small” value moment that doesn’t map to purchase intent.
- Add onboarding steps that connect value to business outcomes (reporting, collaboration, ROI).
- Ensure pricing/plan limits don’t block the “aha” moment.
Metric 9: Early retention (Day 1/7/14 or Week 1/4)
What it tells you: Whether onboarding creates habits.
Activation is a moment. Retention is a pattern. Track early retention cohorts:
- D1 retention: users who return the next day
- D7 retention: users who return within a week
- Week 4 retention: stronger signal for B2B
What to do when early retention is low:
- Add post-onboarding nudges: in-app reminders, lifecycle emails, and “next best action” prompts.
- Ensure users can easily resume where they left off (saved state, drafts, recent items).
- Identify the “second value” moment and guide users to it.
Metric 10: Support load during onboarding (and top friction themes)
What it tells you: Where onboarding is failing users enough that they ask for help.
Track:
- Tickets per 100 new users (first 14 days)
- Time-to-first-response for onboarding-related tickets
- Top categories (integration issues, permissions, setup confusion)
What to do when support load is high:
- Add in-app troubleshooting at known failure points.
- Improve error messages with clear next steps.
- Create a contextual help panel linked to the current screen.
How to build an onboarding metrics dashboard that drives action
You don’t need 40 charts. You need a small dashboard that answers three questions:
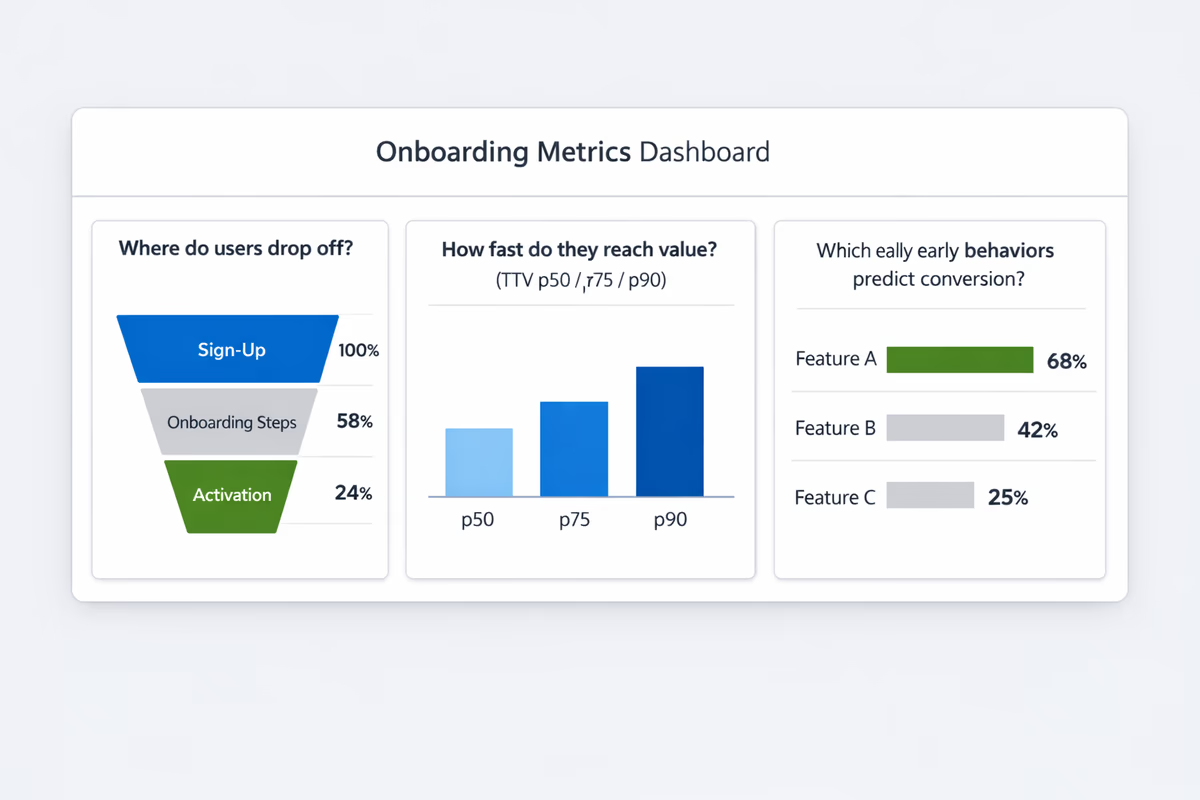
1) Are users reaching value?
- Activation rate (by segment)
- Median time to value
2) Where are they getting stuck?
- Onboarding funnel step conversion
- Drop-off rate by step
- First session completion rate
3) Are activated users becoming customers and staying?
- Trial-to-paid conversion (split by activated vs not)
- Early retention cohorts
- Sticky feature adoption
A simple weekly workflow to improve onboarding with metrics
- Pick one segment (e.g., self-serve trials from paid search).
- Find the biggest drop-off step in the onboarding funnel.
- Watch 5–10 session replays or event trails for that step (quant + qual).
- Ship one change (copy, UI simplification, new tooltip, checklist reorder).
- Measure impact on step conversion, TTV, and activation rate for that segment.
This loop is how teams turn onboarding metrics into compounding retention gains.
What to track in User Tourly (practical instrumentation checklist)
To make these metrics measurable, instrument these events:
- Signup completed
- First session started
- Each onboarding step viewed and completed
- Checklist item completed
- Activation event(s)
- Key feature events (1–3)
- Invite sent / teammate joined (if relevant)
- Trial started / trial ended / upgraded
Then build segments by persona, acquisition channel, and use case selection so you can see which onboarding experiences work for which users.
Onboarding metrics aren’t about reporting. They’re about finding the next bottleneck, removing it, and getting more users to value faster—so activation and retention improve together.
FAQ
What is the most important onboarding metric for SaaS?
Activation rate is the most important starting point because it measures how many new users reach a defined value moment. Pair it with time to value and step-to-step funnel conversion so you know both how many users activate and where the onboarding experience is slowing them down.
How do you define activation in onboarding?
Define activation as a behavior that represents the first real value a user gets from your product. It should be an in-app action (or set of actions) that is repeatable and predictive of retention or conversion—like creating a project and inviting a teammate, not completing a product tour.
Which onboarding metrics help improve retention?
Track early retention cohorts (D1/D7/Week 4), sticky feature adoption in the first 7–14 days, and time to value. These show whether onboarding creates habits and whether users discover the behaviors that correlate with long-term usage.
How do I find where users drop off during onboarding?
Build an onboarding funnel that includes each major step (signup, setup, first core action, collaboration, etc.). Track step-to-step conversion and drop-off rate by step. The step with the largest drop-off is your highest-leverage place to simplify UI, add guidance, or move the step later.
Table of Contents
- Start with a clear onboarding goal: define “activation” first
- Practical rule
- Metric 1: Activation rate (by segment)
- Metric 2: Time to Value (TTV)
- Metric 3: Onboarding funnel conversion (step-to-step)
- Metric 4: Drop-off rate by onboarding step
- Metric 5: First session completion rate
- Metric 6: Onboarding checklist completion rate (and time to completion)
- Metric 7: Key feature adoption during onboarding
- Metric 8: Trial-to-paid conversion rate (with onboarding attribution)
- Metric 9: Early retention (Day 1/7/14 or Week 1/4)
- Metric 10: Support load during onboarding (and top friction themes)
- How to build an onboarding metrics dashboard that drives action
- 1) Are users reaching value?
- 2) Where are they getting stuck?
- 3) Are activated users becoming customers and staying?
- A simple weekly workflow to improve onboarding with metrics
- What to track in User Tourly (practical instrumentation checklist)