Activation Metrics Every B2B SaaS Team Should Track
Activation doesn’t improve with guesswork. This guide breaks down the activation metrics that actually predict trial-to-paid growth—like time-to-value, key event completion, and drop-off rates—plus how to instrument and use them to optimize onboarding with confidence.

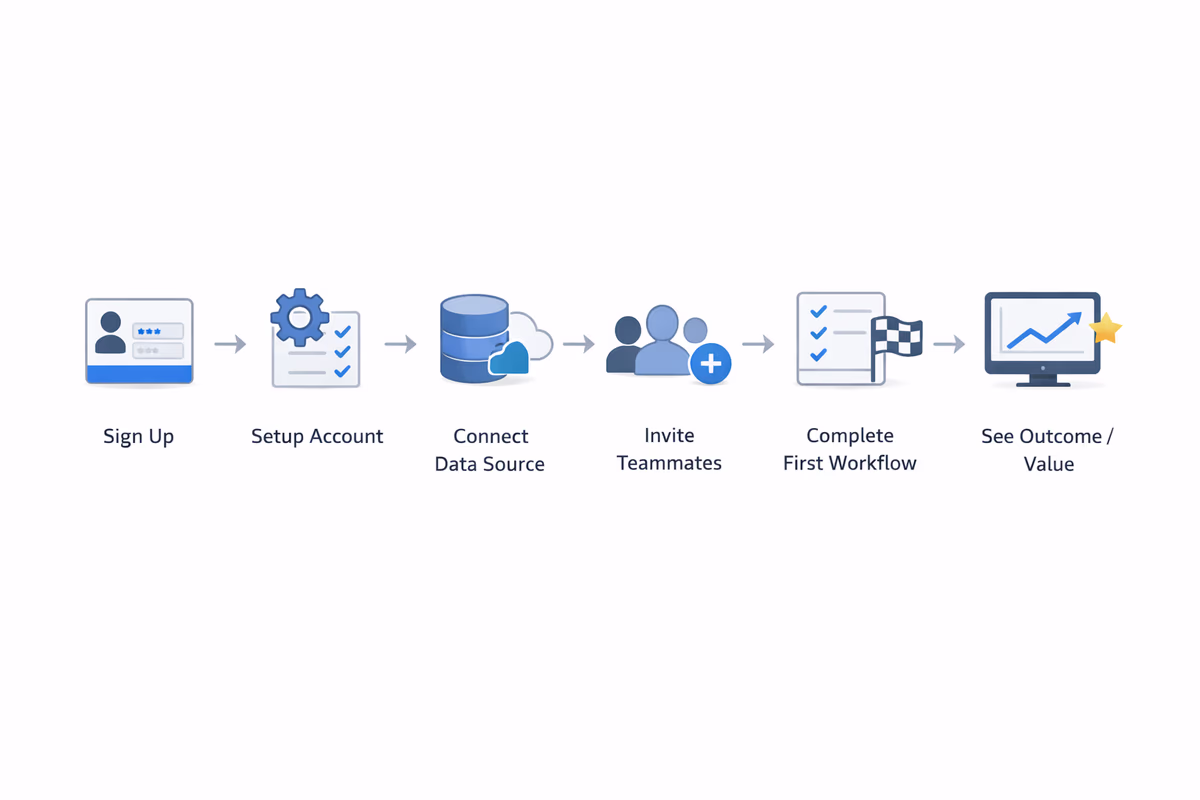
Activation is the moment a user experiences your product’s value in a way that makes continued usage (and payment) likely. In B2B SaaS, activation is rarely “logged in once.” It’s typically a sequence: set up, connect data, invite teammates, complete a workflow, and see an outcome.
If you’re trying to improve activation without a measurement plan, you’ll end up shipping onboarding changes that feel right but don’t move trial-to-paid conversion.
Below are the activation metrics that most reliably predict growth, plus practical guidance on how to define, instrument, and use them.
Start with a measurable activation definition
Before tracking metrics, align on what “activated” means for your product.
A good activation definition has three traits:
- Value-linked: it correlates with retention or conversion (not vanity actions).
- Observable: it’s based on trackable events, not subjective states.
- Fast: it can happen early enough in the trial/onboarding window to influence outcomes.
Example activation definitions (choose one that matches your value)
- CRM: “Created first pipeline + added 5 contacts + logged first activity.”
- Analytics: “Connected data source + created dashboard + viewed it twice.”
- Collaboration tool: “Invited 2 teammates + created a workspace + completed first task.”
Your activation metrics should ladder up to this definition.
Metric 1: Activation rate (by segment)
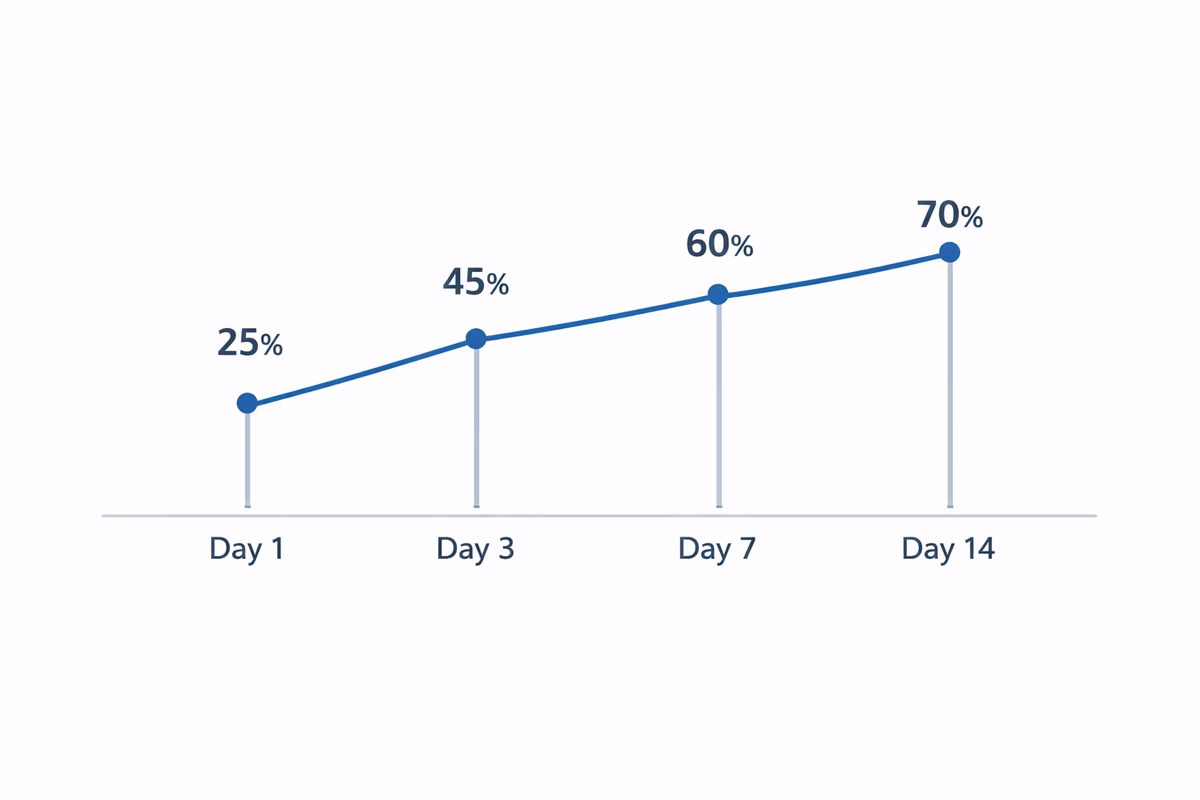
What it is: The percentage of new signups that reach your activation definition within a defined time window.
Formula:
Activated users / New signups (in cohort)
Track it with a window like Day 1, Day 3, Day 7, Day 14 depending on your sales cycle and onboarding complexity.
How to use it
- Make it segment-first. Activation rate averaged across everyone hides the truth.
- Compare by: acquisition channel, persona, company size, use case, plan type, self-serve vs sales-assisted.
What to do when it’s low
- If activation is low across all segments, your activation definition may be too hard or your onboarding is blocking progress.
- If it’s low in one segment, you likely have a messaging mismatch (wrong expectations) or missing path-specific guidance.
Metric 2: Time-to-Value (TTV)
What it is: How long it takes a user to reach a meaningful value moment.
There are two useful versions:
- Time to First Value (TTFV): time from signup to the first “aha” event.
- Time to Key Value (TTKV): time to the activation milestone that predicts conversion.
How to define “value” without guessing
Pick value events that correlate with downstream outcomes:
- higher Week 4 retention
- higher trial-to-paid conversion
- higher expansion likelihood (for PLG)
How to use it
- Track median and P75 (75th percentile). The long tail usually shows onboarding friction.
- Break TTV down by step: signup → setup → first key action → outcome.
What to do when TTV is high
- Remove or postpone setup steps that don’t contribute to first value.
- Add in-app guidance at the exact moment users need it (not a generic tour at login).
- Create a “fast path” for the most common use case.
Metric 3: Key event completion rate (per step)
What it is: The percentage of users who complete each critical onboarding event.
Examples of key events:
- connected integration
- imported data
- created first project
- invited teammate
- configured a core setting
How to structure it
Build an activation funnel with 5–8 steps max. For each step, track:
- completion rate
- median time between steps
- drop-off rate
What to do with the data
- Identify the first big drop-off. That’s usually your highest-leverage fix.
- If users complete Step 1 but stall on Step 2, Step 2 is either unclear, too hard, or not perceived as valuable.
Metric 4: Drop-off rate and friction signals
Completion rates tell you where users fall out. Friction metrics help explain why.
Track these alongside funnel steps:
- Error rate (API errors, failed imports, permission issues)
- Rage clicks / repeated clicks on the same UI element
- Form abandonment (started but didn’t submit)
- Time on step (spikes indicate confusion)
- Help interactions (opened docs, searched help center, contacted support)
What to do when friction spikes
- If errors spike: prioritize reliability and clearer error states before UI polish.
- If time-on-step spikes with no errors: add microcopy, examples, defaults, and contextual tooltips.
Metric 5: Onboarding content engagement (guided vs unguided)
If you use checklists, tours, tooltips, or modals, measure whether they actually help.
Useful metrics:
- Checklist start rate and checklist completion rate
- Guide completion rate (finished all steps)
- Step-level abandonment (where users exit)
- Assisted activation rate vs unassisted activation rate
How to use it
- If guide engagement is high but activation doesn’t improve, your guide is likely teaching the wrong actions.
- If guide engagement is low, the problem is discoverability, timing, or perceived irrelevance.
Metric 6: First session success rate
The first session often determines whether users come back.
Define a “successful first session” as completing 1–3 high-signal actions (not 10 tiny clicks). Examples:
- created first asset
- connected a data source
- invited a teammate
Track:
- % of users who hit first-session success
- session length (use carefully—long can mean confused)
- next-day return rate (D1 retention) for those who succeeded vs not
What to do with it
- Design the first session around a single outcome.
- Remove secondary navigation distractions until first value is reached.
Metric 7: Trial-to-paid conversion (activation-qualified)
Trial-to-paid is the outcome metric. But it becomes actionable when you connect it to activation.
Track:
- trial-to-paid conversion overall
- trial-to-paid conversion for activated users
- trial-to-paid conversion for non-activated users
What to look for
- If activated users convert far more than non-activated users, your activation definition is strong.
- If conversion is similar for both groups, your activation milestone is not predictive—redefine it.
Metric 8: Activation retention (Week 1 / Week 4)
Activation that doesn’t stick is a false win.
Track retention for cohorts based on whether they activated and how quickly:
- Activated within 1 day vs 7 days
- Activated with teammates invited vs solo
- Activated with integration connected vs not
What to do with it
- If fast activators retain more, prioritize reducing TTV.
- If team-based activators retain more, encourage invites earlier (but only after the user sees personal value).
How to instrument activation metrics (without creating a mess)
You don’t need hundreds of events. You need consistent naming and a small set of reliable, value-linked events.
1) Create an event taxonomy
Use a pattern like:
Workspace CreatedIntegration ConnectedProject CreatedInvite SentReport Exported
Avoid ambiguous events like Clicked Button unless paired with context.
2) Track properties that enable segmentation
For each event, capture:
- persona/use case (from signup or inferred)
- acquisition channel
- plan/trial type
- company size (if available)
- role (admin vs member)
3) Define your activation window and cohorts
Pick a cohort definition that matches your motion:
- self-serve trials: Day 7 or Day 14 activation
- sales-assisted POCs: activation within the first X days after workspace creation
Turning metrics into onboarding improvements
Metrics only matter if they drive decisions. Use this simple loop.
Step 1: Find the bottleneck
Look for:
- biggest funnel drop-off
- longest time between steps
- highest error rate
Step 2: Diagnose with qualitative + behavioral data
- Watch session replays for the step
- Read support tickets tagged to onboarding
- Run a 1-question in-app survey: “What stopped you from setting this up today?”
Step 3: Ship one targeted change
Examples:
- add a checklist that reflects the activation funnel
- replace a generic tour with contextual tips triggered by user behavior
- add templates/sample data to shorten time-to-value
- move optional settings after first value
Step 4: Measure impact with a clean comparison
- A/B test when possible
- otherwise compare cohorts pre/post change, segmented by channel/persona
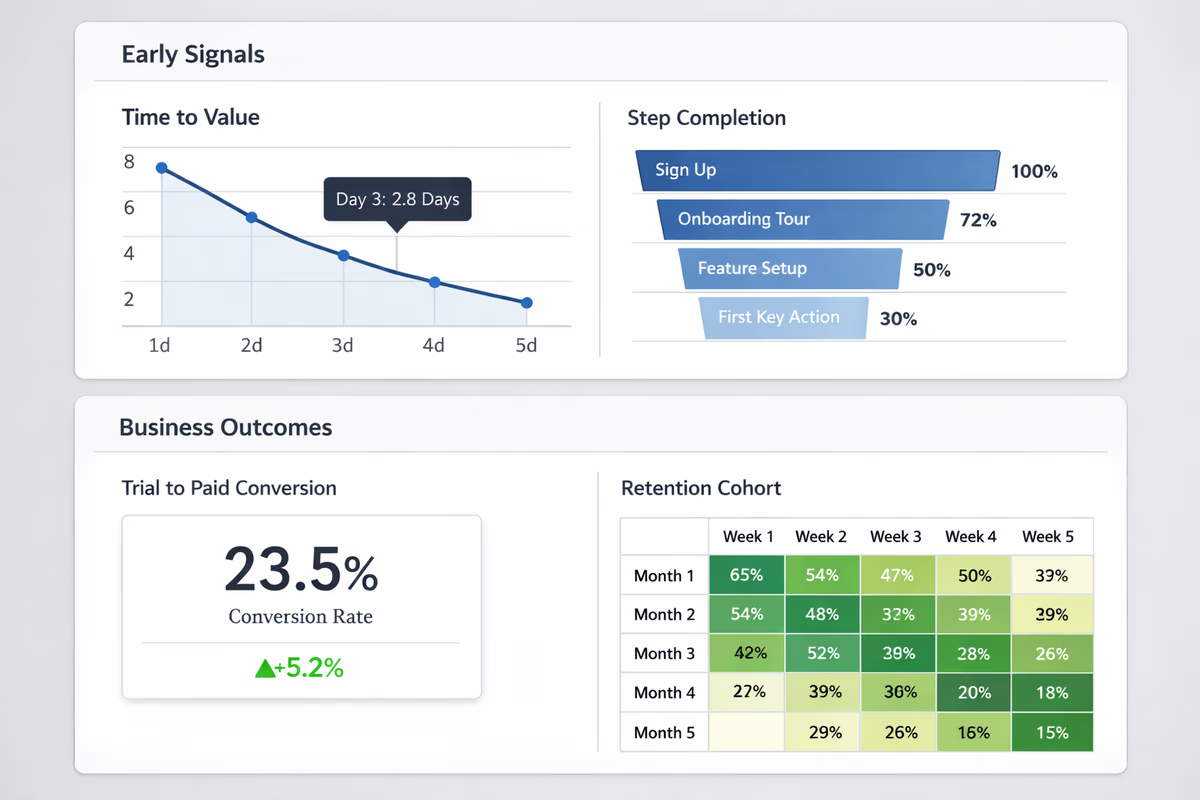
A practical activation dashboard (what to include)
If you build one dashboard for activation, include:
- Activation rate (D1/D7/D14) by segment
- Median and P75 Time-to-First-Value
- Activation funnel step completion + drop-offs
- Error rate on critical setup steps
- Assisted vs unassisted activation rate
- Trial-to-paid conversion for activated vs non-activated users
- Week 1 and Week 4 retention split by activation status
This dashboard gives you both early signals (TTV, step completion) and business outcomes (trial-to-paid, retention).
Where User Tourly fits
User Tourly helps you connect activation metrics to action by letting you build behavior-triggered onboarding (checklists, tours, tooltips) that aligns with your activation funnel. The goal isn’t “more guidance.” It’s the right guidance at the moment users are most likely to get value—and a measurement setup that proves it.
FAQ
What is a good activation metric for B2B SaaS?
A good activation metric is one that predicts retention or conversion. Start with an activation rate tied to a value-based milestone (e.g., integration connected + first workflow completed), then track time-to-value and step completion rates to understand how users reach that milestone.
How do I choose my activation event?
Choose an event (or small set of events) that correlates with downstream outcomes like Week 4 retention or trial-to-paid conversion. Avoid vanity events like “logged in” or “visited dashboard” unless you can prove they predict paid conversion for your product.
What’s the difference between activation rate and trial conversion?
Activation rate measures how many users reach an early value milestone. Trial conversion measures how many users become paying customers. Activation rate is an input metric you can improve through onboarding; trial conversion is the business outcome that should improve when activation improves.
What’s a reasonable time-to-value target?
It depends on product complexity, but the direction is universal: shorter is better as long as value is real. Track the median and the 75th percentile. If the long tail is large, focus on removing setup friction, adding templates, and guiding users through the critical path.
Table of Contents
- Start with a measurable activation definition
- Example activation definitions (choose one that matches your value)
- Metric 1: Activation rate (by segment)
- How to use it
- What to do when it’s low
- Metric 2: Time-to-Value (TTV)
- How to define “value” without guessing
- How to use it
- What to do when TTV is high
- Metric 3: Key event completion rate (per step)
- How to structure it
- What to do with the data
- Metric 4: Drop-off rate and friction signals
- What to do when friction spikes
- Metric 5: Onboarding content engagement (guided vs unguided)
- How to use it
- Metric 6: First session success rate
- What to do with it
- Metric 7: Trial-to-paid conversion (activation-qualified)
- What to look for
- Metric 8: Activation retention (Week 1 / Week 4)
- What to do with it
- How to instrument activation metrics (without creating a mess)
- 1) Create an event taxonomy
- 2) Track properties that enable segmentation
- 3) Define your activation window and cohorts
- Turning metrics into onboarding improvements
- Step 1: Find the bottleneck
- Step 2: Diagnose with qualitative + behavioral data
- Step 3: Ship one targeted change
- Step 4: Measure impact with a clean comparison
- A practical activation dashboard (what to include)
- Where User Tourly fits